|
|
|
|||||||


 |
| Submit Tools | Thread Tools | Search this Thread | Display Modes |

|
#1
|
|||
|
|||
|
Forex Technical & Market Analysis FXCC May 08 2013
Forex Technical & Market Analysis FXCC May 08 2013
What Equity Rally Says About Currencies Over the past week, all of the action has been in equities. U.S. stocks powered to new record highs while currencies consolidated quietly. The U.S. dollar weakened against the euro and Japanese Yen and strengthened against the British pound, Swiss Franc, Australian and New Zealand dollars. This divergent price action confirms that there isn't one directional interest in currencies. Part of the reason why currencies have not enjoyed the same type of strong trend as equities is because this is a QE driven rally and with central banks around the world engaged in new rounds of easing, the availability of more stimulus has been ambiguously positive for stocks. Unfortunately these simultaneous easing programs has also clouded the outlook for currencies as investors wonder which central bank will win the race to debase. The rally in stocks and consolidation in currencies also tells us that investors are much more interested in joining the trend in equities than try to figure out whether support or resistance will be broken in currencies. Eventually this will change but for the time being we can't ignore the fact that the big moves are happening in other markets. However what stocks have done for currencies is keep them supported - if not for the equity market rally, we would have probably seen a deeper sell-off in the EUR/USD and AUD/USD. FOREX ECONOMIC CALENDAR : 2013-05-08 10:00 GMT | EU.Industrial Production s.a. w.d.a. (YoY) (Mar) 2013-05-08 12:15 GMT | CA.Housing Starts s.a (YoY) (Apr) 2013-05-08 17:00 GMT | US.10-Year Note Auction 2013-05-08 22:45 GMT | NZ.Unemployment Rate (Q1) FOREX NEWS : 2013-05-08 04:35 GMT | EUR/USD unable to find direction as global equities continue higher 2013-05-08 03:32 GMT | GBP/USD rally runs out of steam, finishes day sharply lower 2013-05-08 02:37 GMT | Aussie attempting to claw back some losses during Asia trade 2013-05-08 00:24 GMT | USD/JPY edging lower during early Asia trade EURUSD : HIGH 1.30975 LOW 1.30716 BID 1.30926 ASK 1.30932 CHANGE 0.12% TIME 08:12:49 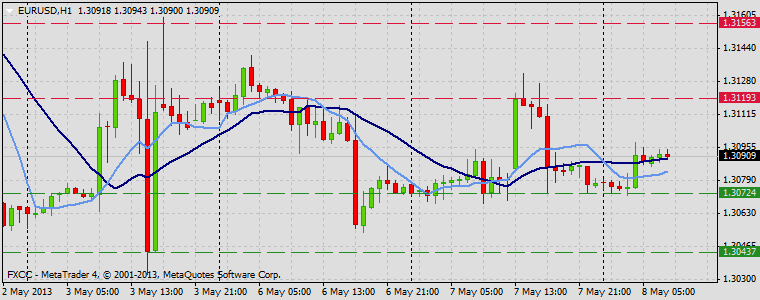 OUTLOOK SUMMARY : Up TREND CONDITION : Sideway TRADERS SENTIMENT : Bearish IMPLIED VOLATILITY : Low MARKET ANALYSIS - Intraday Analysis Upwards scenario: While price is quoted above the moving averages out technical outlook would be positive. Yesterday high offers next resistance level at 1.3119 (R1). Any price action above it would suggest next targets at 1.3156 (R2) and 1.3185 (S3). Downwards scenario: Next support level is seen at 1.3072 (S1), any penetration below it might activate downside pressure and enable lower target at 1.3043 (S2). Any further market decline would then be limited to 1.3010 (S3). Resistance Levels: 1.3119, 1.3156, 1.3185 Support Levels: 1.3072, 1.3043, 1.3010 -------------------------- GBPUSD : HIGH 1.54891 LOW 1.54704 BID 1.54798 ASK 1.54805 CHANGE -0.02% TIME 08:12:50 OUTLOOK SUMMARY : Down TREND CONDITION : Downward penetration TRADERS SENTIMENT : Bearish IMPLIED VOLATILITY : Low Upwards scenario: GBP extended its decline versus the USD and determined a negative short-term technical outlook. However above the resistance at 1.5488 (R1) opens a route towards to next resistive measures at 1.5503 (R2) and 1.5522 (R3). Downwards scenario: On the downside our attention is shifted to the immediate support level at 1.5474 (S1). Break here is required to enable bearish forces and expose our intraday targets at 1.5460 (S2) and 1.5449 (S3). Resistance Levels: 1.5488, 1.5503, 1.5522 Support Levels: 1.5474, 1.5460, 1.5449 ------------------------- USDJPY : HIGH 99.15 LOW 98.64 BID 98.965 ASK 98.969 CHANGE -0.03% TIME 08:12:51 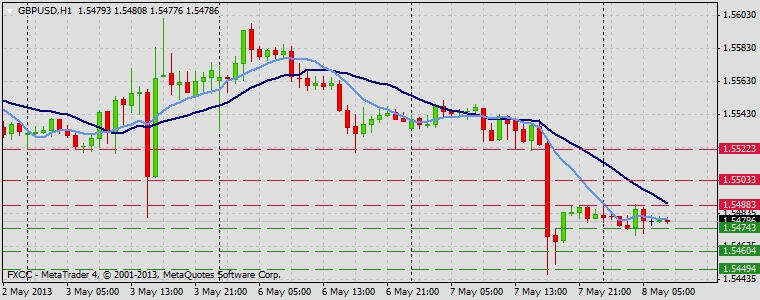 OUTLOOK SUMMARY : Down TREND CONDITION : Downward penetration TRADERS SENTIMENT : Bullish IMPLIED VOLATILITY : Low Upwards scenario: Yesterday high offers key resistance level at 99.27 (R1). Clearance here is required to resume uptrend structure towards to next target at 99.43 (R2) and any further price appreciation would then be limited to last resistance for today at 99.63 (R3). Downwards scenario: On the other hand, price pattern suggests bearish potential if the instrument manages to overcome next support level at 98.78 (S1). Possible price regress could expose our initial targets at 98.62 (S2) and 98.40 (S3) in potential. Resistance Levels: 99.27, 99.43, 99.63 Support Levels: 98.78, 98.62, 98.40 Source: FX Central Clearing Ltd,( ) 
|


|
«
Previous Thread
|
Next Thread
»
| Currently Active Users Viewing This Thread: 1 (0 members and 1 guests) | |
| Thread Tools | Search this Thread |
| Display Modes | |


 Linear Mode

|
|

All times are GMT -5. The time now is 08:24 PM.
|
|